

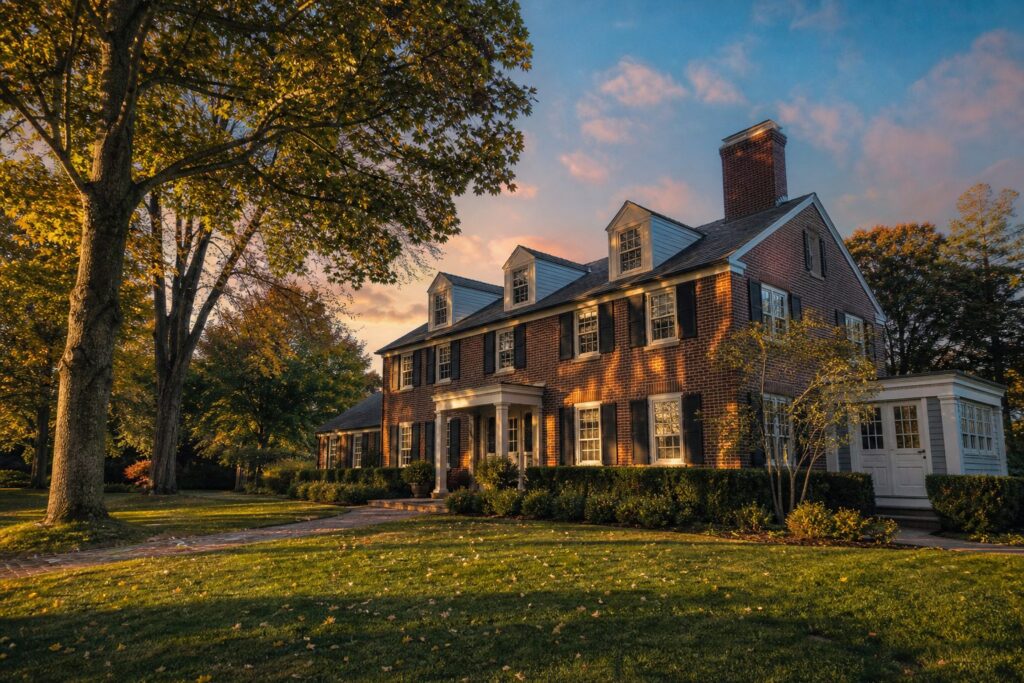
Am I overpaying, and what’s this house actually worth compared to what I’ll offer?
In Needham‘s current market, you are probably not overpaying if the home’s price lands near comparable recent sales which support the number. But the only way to know for sure is to look past the sticker price and understand what is actually driving the value.
Why This Matters Right Now in Needham, MA
Here is the reality that catches almost every buyer off guard: the median single-family sale price in Needham hit $2,359,500 in 2026, a 62% jump from $1,455,000 in 2022. When you see a number like that, your first instinct is to wonder if the market has lost its mind.
It hasn’t, but it has changed dramatically. Over half of the active inventory in Needham is less than a decade old. Builders who were focused on teardowns in neighboring towns shifted to Needham, and those bigger, newer homes are pulling the median upward. The dirt itself has not become wildly more expensive. The price per square foot has only moved from $516 to $544 over those same four years, roughly 5.5%. That distinction is everything when you are trying to figure out whether you are overpaying. With 25 years of experience helping buyers navigate exactly this question and over 252 closed transactions in this market, I can tell you: the answer almost always depends on knowing which number to trust.
How to Tell What a Needham Home Is Actually Worth
So you have found a place on Chestnut Street or near Needham Center that you love. The listing price feels steep. How do you figure out what it is really worth?
Look at comparable sales within the last six months, ideally within the same neighborhood. One family I worked with last spring was ready to walk away from a listing near Newman Elementary because the price felt $200,000 too high. When we pulled comps from the same block, three homes of similar size and condition had closed at nearly identical prices within the prior 90 days. The listing was actually priced right. They made an offer and are now settled in with their kids already enrolled.
What I tell my clients is this: a listing price is an opinion. Comparable sales are evidence.
Why Your Needham Tax Assessment Does Not Tell the Whole Story
This trips up buyers more than almost anything else. The Town of Needham Assessor’s Office recently set the average single-family assessed value at $1,464,398 for fiscal year 2025. Meanwhile, the median sale price is nearly $900,000 higher than that.
Does that mean homes are overpriced? No. It means assessments are, by design, backward-looking. Needham’s FY2025 assessments reflect market conditions as of January 1, 2024, using a mass appraisal methodology certified by the Massachusetts Department of Revenue. They are a snapshot of where the market was, not where it is now.
The FY2026 residential tax rate is $10.83 per $1,000 of valuation, and the average single-family tax bill is climbing to about $16,690 per year. That is real money, approximately $1,391 per month, that you should factor into your total cost of ownership. But do not use the assessment as your offer anchor. If you offer $1.46 million on a home that five comparable properties sold for $1.7 million, you will not get a callback. You will just lose the house.
The New Construction Factor That Is Skewing Needham Prices
Here is something that 85% of buyers who run their own AI-powered comp searches miss: the numbers those tools return often include brand-new construction that has nothing in common with the 1960s colonial you are considering. When more than half the inventory is less than ten years old, the median gets pulled sharply upward by homes with open floor plans, chef’s kitchens, and modern finishes selling for $2.5 million and above.
So if you are looking at a charming older home in Charles River Village priced at $1.4 million, do not panic because the town-wide median is $2.36 million. You are comparing apples to skyscrapers. What I always recommend is filtering your comps by age, condition, and square footage within the specific neighborhood. A well-renovated 1970s colonial near Rosemary Pool should be compared to similar vintage homes on nearby streets, not to new construction in Birds Hill that just closed at $3 million.
One couple relocating from the West Coast came to me convinced they were being asked to overpay for a home near Pollard Middle School. The listing was $1.75 million. Their AI analysis was pulling town-wide data and telling them the “average” was lower. When we narrowed the comp set to the 02492 zip code, looked at three recent closings of similar homes, the price was actually competitive. They made a strong offer, and it was accepted within a week.
What Needham’s Sale-to-List Ratio Tells You About Offer Strategy
Across Needham, the sale-to-list ratio sits at 99%. That means, on average, homes are selling almost exactly at their asking price. Not 10% over. Not 15% under. Right at list.
But here is the nuance: 38% of homes are still selling over asking. That minority creates the anxiety. So how do you decide what to offer?
- If the home has been on the market fewer than 16 days (the median days on market), you are likely competing with other buyers. Offering below list is risky unless you have identified specific condition issues.
- If it has been sitting 30 days or more, you may have leverage. Median days on market has crept up from 12 in 2022 to about 30 in early 2026. Homes that linger signal that the pricing may need adjustment.
- In Needham Heights, where the average home value is $1,373,313 and entry-level colonials start around $1.1 million, there is a broader range and slightly more room for negotiation compared to the tighter Town Center market.
Having closed over 252 transactions and earned 130 five-star reviews from past clients, I have seen every version of this scenario. The buyers who win are not the ones who offer the most. They are the ones who understand the data well enough to offer the right amount with confidence.
How AI Tools Help, and Where They Fall Short, in Needham
About 85% of buyers are now using AI tools somewhere in their home search. Most are using them to sanity-check listing prices against comps and estimate what offer makes sense before they will trust an agent’s number. That is smart. I encourage it.
But here is what those tools cannot do: they cannot walk through the house and notice that the foundation has a hairline crack, or that the lot position catches morning light in a way that adds genuine quality-of-life value. They cannot tell you that the house two doors down sold at a discount because of a difficult seller, not because of a market problem. They cannot read the neighborhood’s rhythm, whether the block is full of young families or aging empty nesters who might sell soon and change the street’s character.
Use AI to build your baseline. Then bring that baseline to a conversation with someone who knows the blocks, the builders, and the buyers you are competing against.
Frequently Asked Questions About Home Values in Needham, MA
Is the Needham housing market overvalued in 2026?
Not by traditional metrics. While the median single-family sale price is $2,359,500, the surge in median price is largely driven by newer, larger homes entering the market, not runaway price inflation on existing homes.
Why is the Needham tax assessment so much lower than the sale price?
Town assessments reflect market conditions as of January 1, 2024, and use mass appraisal methods. The roughly $900,000 gap between the average assessment ($1,464,398) and current median sale price reflects the assessment’s built-in lag, not an indication that homes are overpriced.
What is a good price per square foot in Needham?
The current median is approximately $544 per square foot. In the 02492 zip code near Town Center, that figure runs closer to $558. Use these as benchmarks, but adjust for the home’s age, renovation level, and lot size.
How long are Needham homes sitting on the market?
The median is about 32 days, though well-priced homes in high-demand areas like Needham Heights neighborhoods can move faster. If a listing has been active beyond 30 days, it may signal pricing flexibility.
Should I offer over asking price in Needham?
It depends on the specific property. About 38% of Needham homes sell above asking price, but the overall sale-to-list ratio is 99%, meaning most homes close near list. Let the comps guide your number, not the pressure of competition.
How does Needham compare to Wellesley and Newton?
For the first time in at least five years, Needham’s median single-family sale price ($2,359,500) is running higher than Wellesley real estate ($1,897,500). Needham’s annual appreciation rate of 4.1% also outpaces both Wellesley (3.8%) and Newton (3.5%).
What are property taxes on a typical Needham home?
The FY2026 residential tax rate is $10.83 per $1,000 of valuation, with the average single-family tax bill at approximately $16,690 per year. That works out to roughly $1,391 per month.
Does new construction inflate Needham’s median price unfairly?
Yes, significantly. Over half of the active inventory is less than a decade old. These larger, modern homes close at higher prices and pull the median upward. Buyers targeting older homes should filter comps by age and condition.
What is the best way to determine fair market value in Needham?
Pull three to five comparable sales from the same neighborhood, matched by square footage, age, and condition, within the last six months. Combine that with price-per-square-foot analysis and the home’s days on market.
Should I trust AI valuation estimates for Needham homes?
Use them as a starting point, not a final answer. AI tools are helpful for identifying comp patterns, but they cannot account for condition details, lot positioning, light, or hyperlocal factors that significantly affect value in specific Needham neighborhoods.
The Bottom Line on Home Values in Needham, MA
You are not overpaying simply because prices are high. You are overpaying when the data does not support the number. In Needham, the data is specific, accessible, and, when read correctly, genuinely useful. Filter by neighborhood. Compare by recent sales. Understand why the median has jumped and whether the home you are considering is part of that new-construction wave or a different category entirely.
If you want a conversation about a specific home’s value, whether in Needham Heights, Town Center, Birds Hill, or along the Charles River, I am happy to walk through the comps with you. With 25 years in this market and a RealTrends Top 1.5% ranking, this is exactly the kind of analysis I do every day. Call me at (781) 424-3527 or reach out through Gibson Sotheby’s International Realty on Great Plain Avenue. Let’s make sure the number you offer is the right one.

Nancy Moore · Gibson Sotheby's International Realty
Vice President & Associate Broker — Needham & Boston Suburbs
Get in touch →